Power Included,
SQL Optional
Advanced platform power users and BI Analysts need, without the heavy lifting
Experience business intelligence like never before
|
|
|
| Context! From zero to sophisticated - in minutes: |
|
Context! lets you create advanced reports in minutes. A simple wizard walks you through the required steps and lets you control the presentation of reports and charts - including advanced contextual highlighting and user interactivity features - all with just a few simple clicks.
|
| Better still, Context! is so easy to use and so powerful that, as a power user, you will quickly be able to benefit from advanced analytical calculations like rankings, top n %, bottom n % and dozens more - all available with a single mouse click. Want to style your reports for more impact? In Context! it's all just a few mouse clicks away. In fact, the best part of Context! is that report generation is so easy and intuitive it will give you time for the rest of your work! |
- Advanced Reporting in Minutes | Advanced chart types, one-click analytical functions - easy yet sophisticated
- Powerful Analysis with no SQL | Advanced reporting and analysis - no SQL coding necessary
- The Right Visualization for the Job | 44 visualization styles give you the right visual for just about any need
- Publish Once, and only Once | One report you can share with all users - field-level security for ultimate ease of reporting
|
 |
| Powerful analysis, no SQL required |
| Need to create reports from multiple data sources? Why bother IT when you can do it in just minutes? Context! is 100% point-and-click so that even advanced, multi-data source reports can be done without ever touching a line of SQL code: |
- Link reports with filters to create chains of discovery
- Create dynamic "what-if" calculators with data variables
- Create reports based on multiple data sources without any scripting
- Create sophisticated visualizations like GIS and Heatmaps in minutes
|
 |
| Don't create reports, visualize |
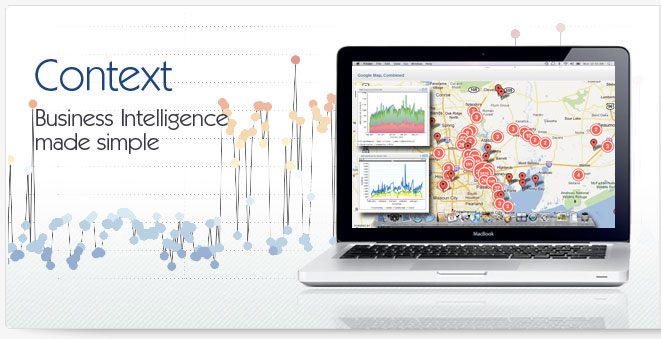
| Context! gives you a powerful data visualization environment. With support for over 44 chart types, Context! lets you leverage advanced visuals like GIS reporting, Google Maps integration, Spider reports, Scatter diagrams, Statistical charts and many more to create the right visual for the right analysis: |
- Built-in GIS reporting capabilities without added fees or servers
- Advanced visualizations like GIS, Google Maps, Histograms and more
- One-click advanced analytics to rank and analyze data
- Advanced formatting and publishing capabilities
|
 |
| One report for all users - Impossible? |
| One report that all users can share - regardless of security. With Context! it's simple. Field-level security lets Context! automatically determine who should see what data. That means you only need to worry about one report - regardless of user. But it doesn't stop there. Context! security features give ultimate control over how reports are created and shared: |
- Field-level security lets you build single reports for multiple types of users
- Control report distribution and proliferation with approval processes
- Limit report storage access to create "in progress" and "in production" models
- Create field-dependent drill-throughs that are controlled by security
|


