Definition of a Balanced Scorecard Dashboard
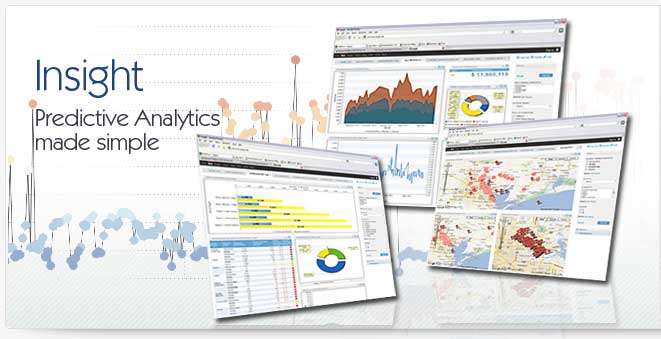
A balanced scorecard dashboard is a set of charts and reports, displayed in a dashboard format, designed to implement the balanced scorecard methodology of business management. With balanced scorecard dashboards businesses can track key metrics that gauge how the organization is performing against corporate strategies. With a balanced scorecard dashboard an organization measures financial, operational, sales and other corresponding metrics to identify the full picture of the organization, hence the "balanced" name of a balanced scorecard dashboard.
How to Create a Balanced Scorecard Dashboard
Creating a balanced scorecard dashboard can be accomplished in a number of ways. The simplest to deploy method is to use already available tools like spreadsheet software to create a set of reports and charts that will be updated on a regular interval. The balanced scorecard dashboard approach requires that managers have access to the metrics information on a regularly updated basis, making tools like spreadsheets ultimately poorly suited for an effective balanced scorecard dashboard. In most organizations, balanced scorecard dashboards are deployed using specialized business intelligence platforms. This form of a balanced scorecard dashboard can provide real-time data delivery and a great deal more power.
Benefits of a Balanced Scorecard Dashboard
The single biggest benefit of a balanced scorecard dashboard is the ability of managers to make decisions quickly and in real-time when identifying areas of the business that are not performing according to expectations. A properly deployed balanced scorecard dashboard should provide users with reports and charts that give insight and provide an easy to use and understand way of identifying areas of the business that are straying from desired results. For this reason a balanced scorecard dashboard should provide visual indicators like conditional highlighting and other measurement tools to provide alert conditions to managers.
Perils of a Balanced Scorecard Dashboard
While the benefit of a balanced scorecard dashboard are immense there are also perils. The biggest challenge of a balanced scorecard dashboard is poor data. In order for the balanced scorecard dashboard to be effective it must be based on metrics and data that are important and relevant to the organization. The challenge, therefore, is for the company to identify the metrics and data sets that best represent whether the company is staying true to its strategic vision. This challenge is not only one at the highest levels of the organization, it must also be identified at the manager level since that's where the balanced scorecard dashboard will provide the most impact.
Getting data to your Balanced Scorecard Dashboard
In order to get the right data into your balanced scorecard dashboard, the first step will be to identify which systems the data lives in. These will often be different for each department and in many organizations will live in different physical servers and software platforms. The balanced scorecard dashboard must be able to tap into these various systems to be effective. In the past the data warehouse was the best way to enable the balanced scorecard dashboard by providing a repository of data that acted as an "aggregator" for the balanced scorecard dashboard. Modern balanced scorecard dashboard systems provide better means of getting to the critical data.
|


