Definition of Dashboard Charts
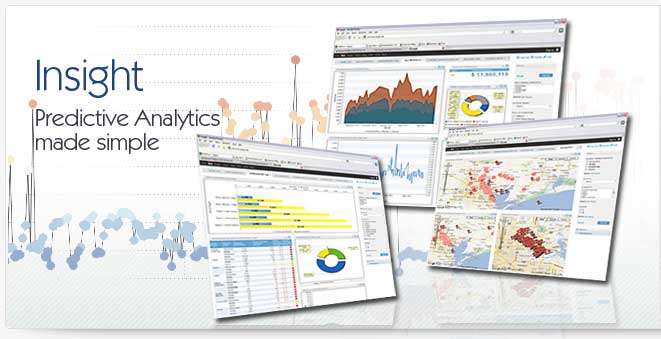
Dashboard charts are merely information charts similar to pie charts or a bar charts displayed within a dashboard. Dashboard charts are typically an element used within a business dashboard. Dashboard charts are often configured to provide data related to a particular information set, normally as components of a broader set of dashboard charts, all designed in concert to furnish business professionals with key information related to the execution of the business as it compres to global goals or strategy.
Dashboard charts vs. Spreadsheet Charts
The most significant advantage of dashboard charts compared to spreadsheet chart is in the way in which information is updated. In dashboard charts the information is always updated at a pre-set interval. The data available to the dashboard is updated on a regular interval making the dashboard charts update accordingly. In the past creating dashboard charts was often a difficult and lengthy exercise, which is why many users have traditionally preferred excel charts over dashboard charts. New dashboard charts tools are now becoming available, however, that are making the creation of dashboard charts faster, easier and more interactive.
Usage of a dashboard charts
Dashboard charts can be used in a number of ways. The fundamental use of the dashboard charts is to provide the reader with a graphical representation of critical data. A line chart on sales might be used to show sales operations by region. As the sales for the company grow or fall, the line chart is going to change accordingly. Dashboard charts are also usable in a number of other methods as well. Users may want to export dashboard charts for use in more traditional applications and uses. A sales manager may want to export dashboard charts for use in a presentation to upper management.
Features of a dashboard charts
At first glance the concept of "features" in dashboard charts may seem counter-intuitive, after all how can dashboard charts have "features"?. When it comes to dashboard charts, however, features are very important to users. Dashboard charts should provide features to the user that allow the viewer to manipulate the data of the dashboard charts without having to recreate or alter the chart from its basic format. The dashboard charts might have drill-down capabilities for example, or they may pass data from one chart to another with a "drill-through" format. With drill-through charts, clicking on an element of the dashboard charts sends data variables to different dashboard charts. For example, clicking on the "northwest region" section of a pie chart passes the variables of "north-west" territory and the year 2007 variables to a bar chart designed to show sales expenses.
Dashboard charts examples
There are many dashboard charts that can be used by business users to analyze data. Standard dashboard charts like pie charts and bar charts are common dashboard charts, but there are other, more advanced dashboard charts that show more information in a single chart. One example of these advanced dashboard charts is the scatter chart, that can show three and even four variables on a single field of view.
|


