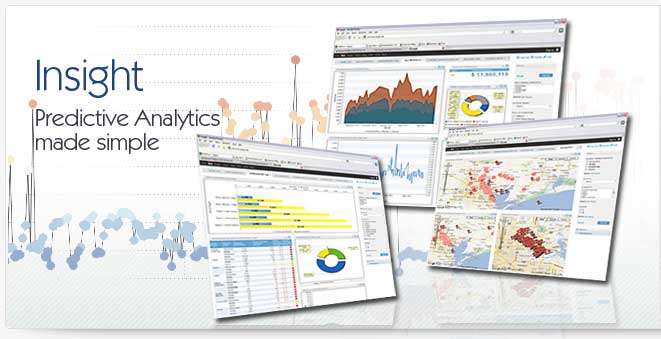
KPI Dashboards
KPI dashboards provide business users with an easy to use, easy to visualize means of displaying and measuring key company data. This key company data is known as a Key Performance Indicator, or KPI. The KPI dashboard is typically designed for measuring performance of an organization. The KPIs behind the KPI dashboards are known as performance metrics and are core business measurements designed to gauge operational performance. For example, a key KPI for a sales organization might be a "book to bill" ratio, the ratio of dollars booked by the sales team vs. dollars invoiced by the organization.
How KPI Dashboards Work
KPI dashboards are typically available in one of two forms, traditional, static KPI dashboards provide a "snapshot" of business performance, measuring how the business is operating against key metrics at any one given point in time. These types of KPI dashboards are often "refreshed" on regular intervals, either manually the users or through some automated system controlled by the KPI dashboard software. A more recent and increasingly popular form of KPI dashboards are "real-time" KPI dashboards. In real-time KPI dashboards the data behind the performance metrics is updated in or near to "real-time" - that is, as the data is inputed in source systems, the changes are reflected in the KPI dashboards immediately.
Software for KPI Dashboards
The software required to create and manage KPI dashboards is typically known as business intelligence software. Business intelligence software platforms can provide a number of ways of creating and publishing KPI dashboards using a number of different chart types and report styles to provide the right information to the right users at the right time. As KPI dashboards become increasingly popular, businesses are challenged with finding KPI dashboard software that is easy to deploy, easy to maintain and that puts as much of the power to create the KPI dashboards in the hands of users. This is also known as "Agile" business intelligence software.
Designing KPI Dashboards
When creating kpi dashboards there are a number of vital considerations that have to be brought to bear. Key among them is deciding on the performance metrics that will make up the kpi dashboards. In order for kpi dashboards to be effective, the metrics being displayed must be useful to the organization and must provide information that helps users gauge if the business is performing as expected, underperforming or over performing. Another key consideration in your kpi dashboards is usability, specifically, can the kpi dashboards be set up and displayed in an intuitive manner that allows users to understand what is happening at a glance, without requiring a great deal of interactivity.
Dangers of KPI Dashboards
Poorly designed kpi dashboards can often lead to decisions that can be extremely detrimental to the organization. Poorly designed or deployed kpi dashboards could be dashboards that display incorrect data but they could also be kpi dashboards that display data in a time interval that is not appropriate for the given manager, department or organization. For these reasons it's critical to select kpi dashboards software platforms that provide maximum flexibility in designing static or real-time kpi dashboards.
|


