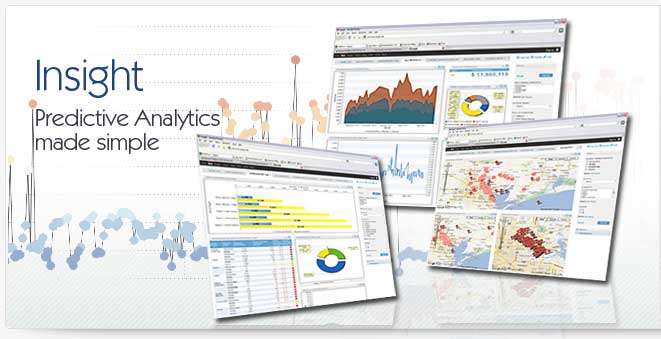
Understanding Drill Down Dashboards
Drill down dashboards are business intelligence dashboards that include charts and data visualizations that allow the user to narrow the scope of the information to specific segments. For example, in a drill down dashboard a user might click on a national sales map by region to better understand the distribution of sales in the western territory by sales representative. The use of drill down dashboards then provides business managers with an effective means of understanding the business.
Drill Down Dashboards vs. Traditional Dashboards
Unlike traditional BI dashboards, drill down dashboards provide the user with an effective means of gaining greater insight into the business without having to go back to the IT or business analysts for more data. Traditional dashboards were designed to provide "snapshots" of information, mainly static data that was refreshed on a set interval. The use of drill down dashboards on the other hand is helping to pioneer the concept of self-service or "agile" business intelligence with the goal of giving users the power to understand data on their own.
Drill Down Dashboards vs. Drill Down Charts
The concept of drill down dashboards can be thought of in one of two ways. First, a drill down dashboard can simply be a collection of charts that provide drill down capabilities, each chart having it's own unique set of drill downs. Another application of drill down dashboards, however, involves joining the charts together. This form of drill down dashboards provides users with a dynamic set of charts, all tied to one another and acting in concert. In this form of drill down dashboards, as the user clicks on one chart the other dashboard charts change in concert. These drill down dashboards give users a much more powerful data visualization by helping to understand how data elements relate to each other.
Drill Down Dashboards vs. Scorecards
Unlike drill down dashboards, scorecards are designed to provide information that for the most part does not need to be acted on. While some users may see scorecards and drill down dashboards as independent of each other, drill down dashboards can actually be used in concert with scorecards to better understand data. The drill down dashboards provide the user with a way of understanding data, while the scorecard provides the user with a way of understanding which data should be looked at in more detail.
How to Build Drill Down Dashboards
Building drill down dashboards can be either a very simple or very complicated process. To build drill down dashboards many systems require a heavy amount of scripting designed to create relationships. New systems are coming to market, however, that make drill down dashboards easy and intuitive to build. Systems like Context! use filters to build drill down dashboards that can be applied to one or across multiple charts. These drill down dashboards essentially use the notion that as long as charts share one or more elements in common, even if those data elements are not on the chart, the drill down dashboards should be easy to build.
|


